Gantt Charts. Built Different.
Simple, Quick, & Intuitive Project Management
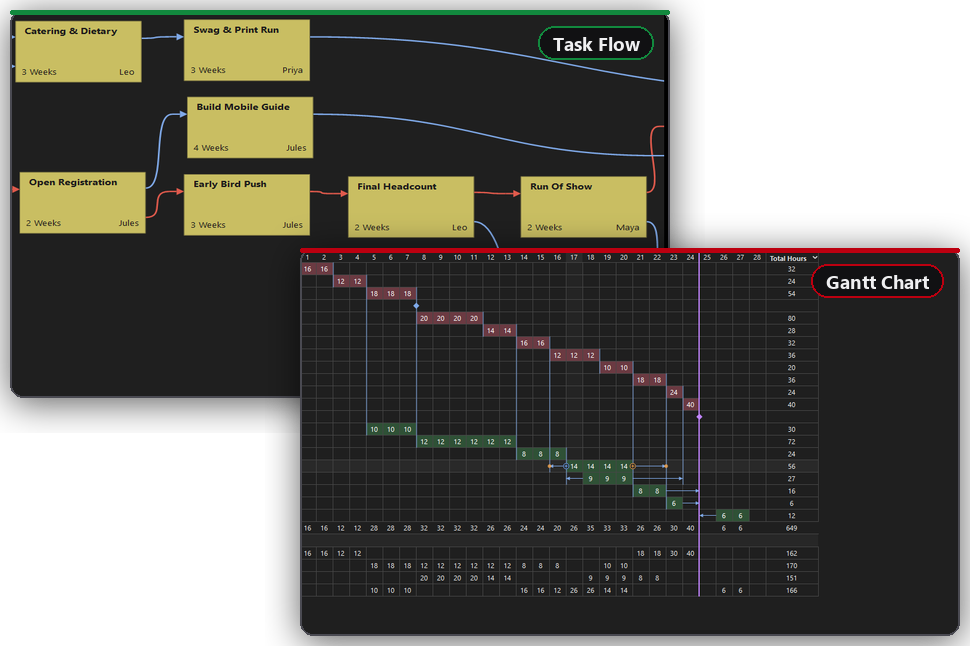
- Connect the work with task cards in Task Flow.
- Instantly turn task cards into your initial Gantt Chart.
- Easily drag, extend, and edit your task bars.
Try GanttRight free for 30 days. No risk.
6 Ways GanttRight Is Built Different
Most project management software asks you to type a schedule before you are ready and hands you a bar chart afterward. GanttRight cuts the whole job to three moves: write the cards, build the schedule, adjust the bars.
Start in seconds, with no setup
Name the work one card per job on the Task Flow board, then shuffle the cards until the order looks right. There is no wizard, no field to fill in, and no date to commit to before you understand the job. When the shape is right, Build Schedule turns the whole board into a real timeline in one step.
The chart builds itself from the cards
Every card becomes a bar and every arrow becomes a dependency, so nothing is entered twice. The half people dread — laying out the chart — is already finished by the time you arrive at it. That is the hour this saves you, every project.
One click shows what can wait and what cannot
One click traces the chain that controls your finish date and colors it. Everything else turns green and hangs off that spine with the room it actually has. Which work can wait becomes something you see at a glance instead of something you sit down and work out.
Numbers go straight onto the bar
Hours and cost are editable cells in the row itself, the same cells that draw the bar. Type into one and the totals move as you type. No dialog to open, no second screen to keep in step, nothing filed away behind the picture.
Update progress by painting over it
The Paint Completion tool marks periods done by painting over them, one period at a time or a whole run in a single sweep. Updating a plan on Monday morning takes a drag, not a round of data entry.
Four gestures cover almost everything
Drag to create, drag to move, drag to link, drag an edge to resize. That is most of the application. Each gesture previews before it commits and Escape cancels, so there is nothing to memorize and nothing to be careful about.
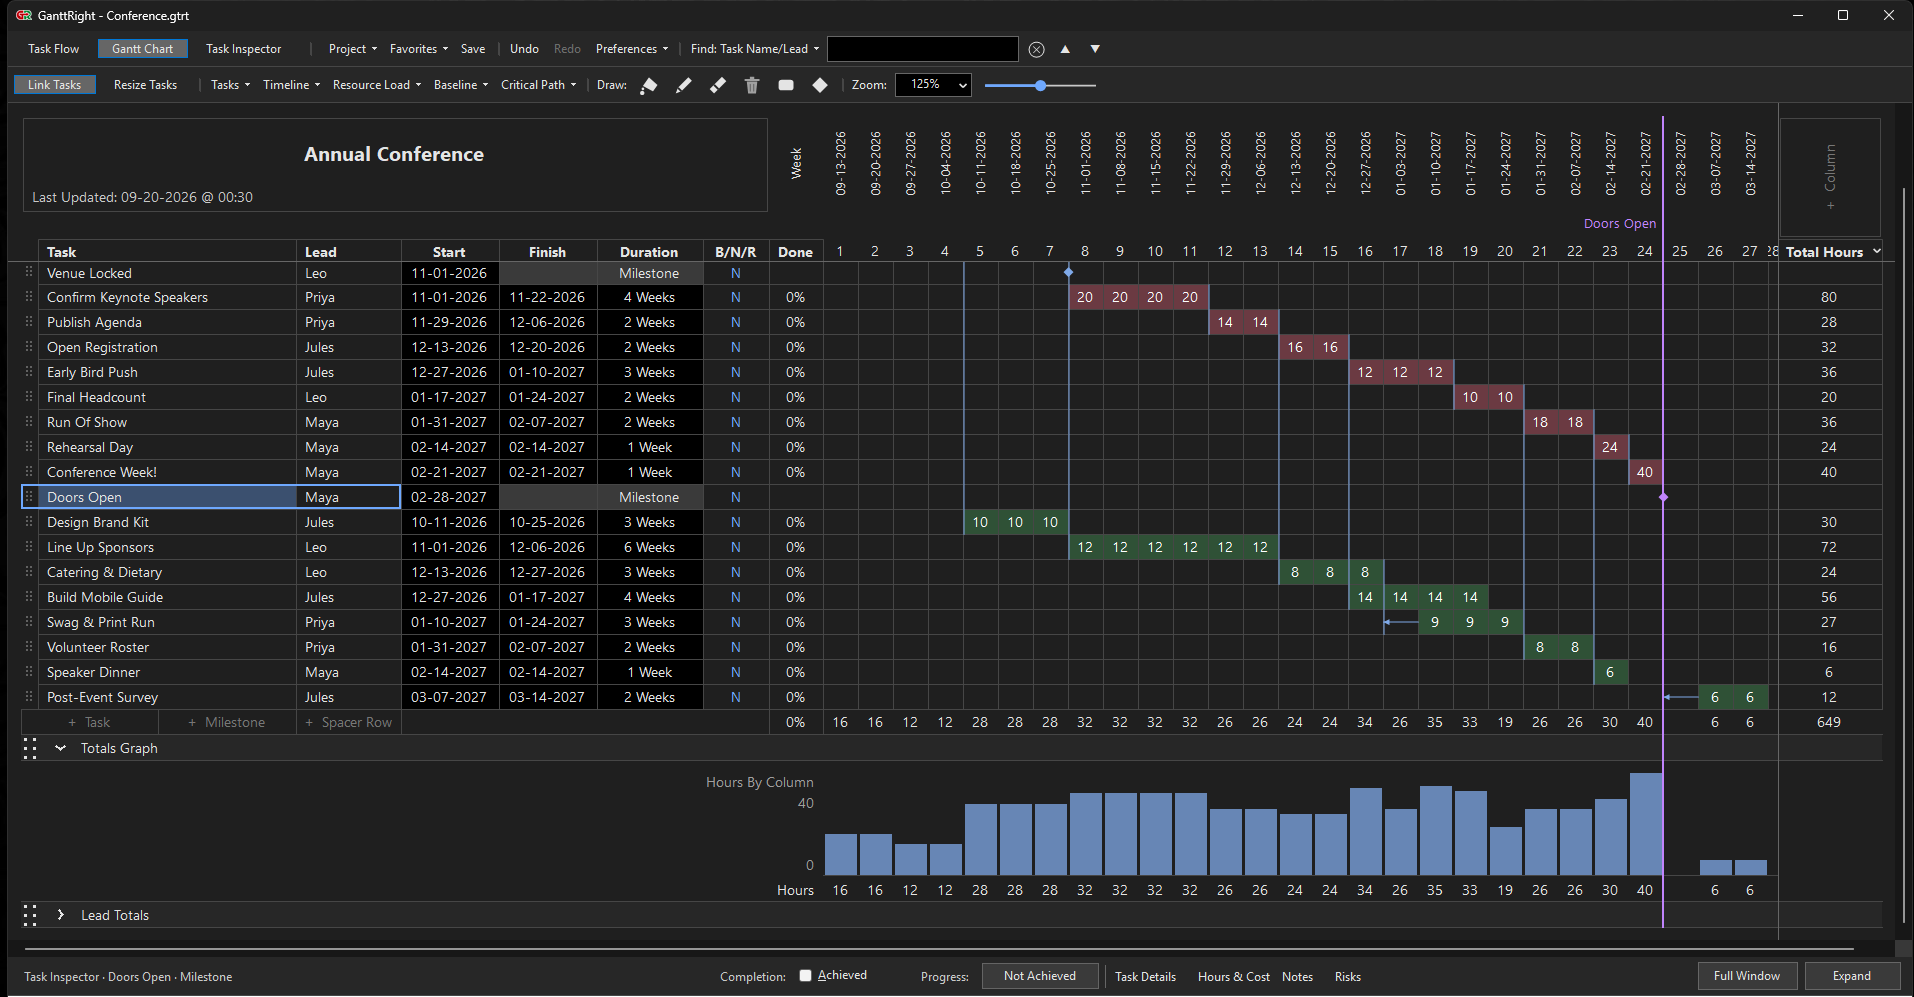
- Critical — the longest path to project completion
- Floating — has room to move
- Milestone — a moment to hit
Why the Task Bars Link Differently
In most Gantt software a dependency is just a line between two bars. The critical path is a report you run afterward that colors some of them red. GanttRight treats both as structure. A link is a rule the chart enforces while you draw it. Every task is classified by what that structure makes it: Critical or Floating.
A link is a rule, not a drawn line
Pull a connection that cannot work — a loop back on itself, two starts tied together, a finish that has to precede its own predecessor — and the target hatches red and names the reason before you release the mouse. Nothing is committed and then corrected later. The chart refuses the link at the moment you try to draw it, which is why a GanttRight plan cannot quietly contain a dependency that never made sense.
The critical path is the longest chain through the plan
Every route from the first task to the last has a length: the sum of the work along it, plus the waiting the links impose. The longest of those routes is the critical path. That length is the length of the project. Nothing finishes sooner than the longest chain allows, no matter how much slack the other work has. One click traces it and colors it, so the chain that owns your finish date stops being an argument and becomes a picture.
Critical and Floating are task types, not highlights
Confirming the path writes the classification onto each task. That is the difference that matters: a floating task is not merely colored differently — it is structurally attached to the critical work it hangs from. Arrange Floating Task Bars then lays those rows out against the spine, favoring shorter connections and fewer crossings, so a chart with sixty tasks still reads as one backbone with work hanging off it rather than sixty bars in a heap.
You can see the room, then feel where it ends
Float is drawn as track with two ends, not printed as a number in a column you have to interpret. Grab a floating bar and drag: it moves freely inside the room it genuinely has, then clamps at the point where a link, a lag, a fixed critical task, or the project finish stops it. You never have to calculate whether a task can slip by a week. You push it and find out. If the answer is no, the chart tells you what stopped you.
Resource Load answers the question the bars cannot
Turn on the Totals Graph and Lead Totals underneath the chart and a second picture appears: hours by column, and hours by the person who owns them. Set Hours Capacity Per Column and anything over that capacity is flagged rather than discovered later. Now drag a bar. The work moves and the totals redraw. The week you just overloaded shows up while your hand is still on the mouse — not in a report you would have had to ask for after committing the change.
The short version. Other charts let you draw anything and tell you afterward. This one builds the plan out of rules, shows you the chain that decides the date, hangs everything else off that chain, and lets you push a bar until the plan itself says stop.
Try GanttRight on Your Next Project
30 days free, no card. Install from the Microsoft Store and the trial starts. Plan a real project with GanttRight — that is the only test that tells you anything.
Install it and the 30 days start. No card, nothing to cancel — decide at the end, not before.